
When HR and finance teams talk about “headcount,” they rarely mean just base salary. Every new hire brings along payroll taxes, benefits, tools, onboarding time, and the risk of turnover.
That’s why understanding the real cost of an employee is now a strategic priority, not just an accounting exercise. If you underestimate it, you’ll overspend on hiring and underfund critical initiatives. If you overestimate it, you might freeze roles that could actually fuel growth.
In this article, we’ll break down how to calculate the true cost of an employee, which cost components HR should track, and how tools like an HR cost calculator can make this process repeatable and data-driven.
What Is the Real Cost of an Employee?
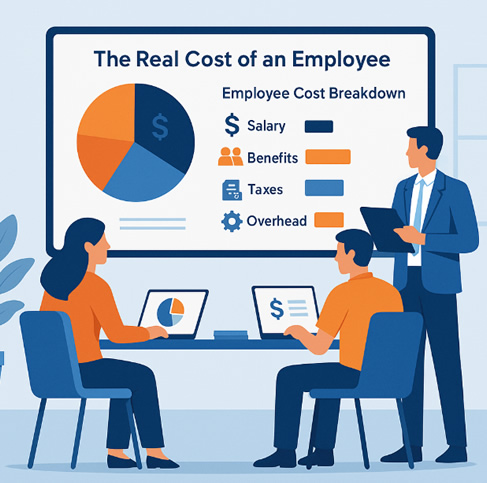
The real cost of an employee is the total amount your company spends to employ a person for a given period (usually one year). It includes:
- Direct compensation (base salary, bonuses)
- Mandatory employer taxes and social contributions
- Benefits (healthcare, retirement, insurance, wellness plans)
- Tools and software licenses
- Training and onboarding
- A share of overhead (office, equipment, management time)
- The cost of turnover and replacement when they leave
Multiple studies and business resources estimate that the real cost of an employee is typically between 1.25 and 1.4 times their base salary.sba.gov + Massachusetts Institute of Technology
So a $60,000 salary often translates into $75,000–$84,000 in total annual cost.
Why Salary Alone Is Misleading
If HR plans headcount on salary alone, three big problems show up later:
- Budget overruns.
You approve 10 new hires at $60,000 each, assuming $600k in cost. In reality, with benefits and overhead, the cost might be closer to $750k–$800k. - Wrong hiring vs. outsourcing decisions.
Without the full cost per employee, it’s impossible to compare hiring internally vs. using an outsourced provider, contractor, or Employer of Record (EOR). - No clear ROI on HR programs.
Initiatives designed to reduce turnover, improve engagement, or upgrade tools are harder to justify if you can’t show how much each employee really costs.
A clear cost-per-employee model gives HR and finance a common language and makes workforce planning much more predictable.
The Basic Formula: Employee Cost Multiplier
Most companies start with a simple formula:
Real Cost of Employee = Base Salary × Cost Multiplier
Where the cost multiplier typically ranges from 1.25 to 1.4 for many businesses, depending on local taxes, benefits generosity, and overhead.venasolutions.com+TimeCamp
Examples:
- Salary = $50,000 → Real cost ≈ $62,500–$70,000
- Salary = $80,000 → Real cost ≈ $100,000–$112,000
This rule of thumb is great for quick planning, but for serious budgeting and scenario analysis, you need to break the multiplier down into clear components.
Breakdown of Employee Cost Components
Here’s a simplified framework you can adapt in your HR + finance meetings.
| Component | What It Includes | Typical Range |
|---|---|---|
| Base Salary | Gross annual wage or base salary agreed with the employee. | 100% of base |
| Employer Taxes & Social Contributions | Payroll taxes, social security, unemployment insurance, statutory contributions. | 10–20% of salary (varies by country) |
| Benefits | Health insurance, retirement plans, life/disability insurance, allowances, wellness programs. | 20–35% of salary for generous packages |
| Tools & Software | Laptop, phone, HRIS/ATS seats, collaboration tools, licenses for role-specific software. | $1,000–$5,000 per year per employee |
| Training & Onboarding | Onboarding time, training courses, certifications, manager/co-worker time. | 10–20% of salary in year one; lower later |
| Facilities & Overhead | Office rent, utilities, security, equipment, shared services allocated per head. | 5–15% of salary (varies remote vs. office) |
| Turnover & Replacement | Recruitment, vacancy time, onboarding replacement, lost productivity when someone leaves. | 30–200% of salary when turnover occurs |
Even if you don’t calculate each line item in detail, simply mapping them out helps HR leadership explain headcount costs clearly to finance and the C-suite.
The Hidden Cost You Can’t Ignore: Turnover
Turnover is one of the most expensive and least visible components of employee cost.
Research suggests that replacing an employee can cost from one-third up to two times their annual salary, depending on role seniority.Built In+ Kreischer Miller
That includes:
- Recruitment and advertising
- Recruiter + hiring manager time
- Background checks and assessments
- Onboarding and training the replacement
- Lost productivity during vacancy and ramp-up
- Impact on morale and team performance
For a $70,000 role, that could mean $23,000–$140,000 per turnover event.
When you combine this with the cost multiplier (1.25–1.4× base salary), you see why retention programs and better hiring decisions can have a massive ROI.
This is where tools like pre-employment testing and candidate skill testing come into play: they reduce the risk of bad hires by giving you objective data before you extend an offer. (On HRYP, you can try the dedicated Candidate Skill Testing tool to generate AI-powered assessments and structured reports.)
How HR and Finance Can Use Employee Cost Data
Once you understand your “all-in” cost per employee, you can use it to support multiple decisions:
Workforce planning & budgeting
- Estimate the cost of growth scenarios (“What if we add 15 sales reps next year?”)
- Compare internal hiring vs. outsourcing to payroll providers or EOR partners
- Allocate budgets by region, function, or business unit based on real cost, not guesses
Here, it helps to combine cost data with HRYP’s tools like the Payroll Providers Comparator and country-specific articles (e.g. your list of payroll companies in the USA at https://hryp.com/list-of-payroll-companies-in-usa/).
Total rewards strategy
- Benchmark your benefits mix and how it impacts the total multiplier
- Model the impact of improving benefits vs. offering higher base pay
- Communicate Total Rewards to candidates more transparently (“Your package is worth $X, not just your salary”)
Retention and engagement
- Quantify the financial impact of high turnover in specific teams
- Build the business case for engagement programs, leadership training, or employee recognition platforms
- Track cost-of-turnover savings over time as a KPI for HR
Scenario analysis for HR tech investments
- Compare the cost of manual processes (spreadsheets, email) vs. HR tech automation (HRIS, ATS, payroll platforms)
- Evaluate the ROI of tools that reduce time-to-hire, automate compliance, or improve payroll accuracy
On HRYP, the HR Tools hub is a good starting point to explore options for HR tech, payroll, and budgeting tools that fit your budget.
How to Calculate the Real Cost of an Employee (Step-by-Step)
Here’s a simple framework you can adapt inside your company.
Step 1 – Start with base salary
Take the gross annual salary (or target OTE for sales roles).
Example: $60,000.
Step 2 – Add employer taxes and mandatory contributions
Work with finance or payroll to calculate:
- Social security contributions
- Unemployment insurance
- Other statutory contributions
Example: 15% of salary → $9,000.
Step 3 – Add benefits
Include:
- Health / dental / vision insurance
- Retirement contributions
- Life and disability insurance
- Allowances (meal, transportation, Internet)
- Wellness stipends, etc.
Example: 25% of salary → $15,000.
Step 4 – Add overhead and tools
Estimate annual cost per FTE for:
- Office or co-working space
- Equipment (laptop, phone, peripherals)
- Software licenses (HRIS, ATS, CRM, collaboration tools)
- Shared services (IT, admin, security)
Example: $6,000 per year.
Step 5 – Add training and onboarding
Estimate what you spend (time + money) on:
- New hire onboarding programs
- Courses and certifications
- Internal training sessions
Example: $3,000 per year (may be higher in year one).
Step 6 – Factor in turnover risk
You don’t need a precise number for each individual, but you can compute:
Annual turnover cost per role =
(Average turnover cost for that role × turnover probability)
If replacing that role costs about 50% of salary (a common estimate for many jobs)G&A Partners+1 and the annual turnover probability is 10%, then:
- Turnover cost per year = $60,000 × 0.5 × 0.1 = $3,000
Step 7 – Put it all together
Using our example:
- Base salary: $60,000
- Employer taxes: $9,000
- Benefits: $15,000
- Overhead & tools: $6,000
- Training: $3,000
- Turnover cost (expected): $3,000
Real cost of employee ≈ $96,000
That’s a cost multiplier of 1.6× salary in this example — higher than the standard 1.25–1.4× rule, because the company offers generous benefits and has noticeable turnover.
This is exactly why having your own internal calculation is so important.
Using HRYP’s HR Cost Calculator to Automate the Process
Manually recomputing these numbers for every scenario is tedious. That’s where tools packed with HR logic can help.
On HRYP, the HR Cost Calculator is designed to:
- Let you plug in base salary, benefits, taxes, overhead and headcount
- Show the full annual cost per employee and per team
- Model “what if” scenarios (e.g., different countries, benefits, or remote-first options)
- Compare manual payroll vs. using a global payroll provider (you can pair it with the Payroll Providers Comparator and vendor listings in your HR Vendors Directory)
For HR leaders, this turns complex conversations with finance into simple, visual scenarios:
- “If we add 10 remote sales reps in the U.S., here is the total annual cost.”
- “If we move payroll to a global provider, here’s the potential savings vs. managing it internally.”
- “If we cut turnover by 20%, here’s how much we save in replacement costs.”
Final Thoughts
The real cost of an employee has never been more important to understand. With rising salaries, competitive benefits, and the shift to distributed teams, guessing is no longer acceptable.
By:
- Breaking down each cost component,
- Incorporating turnover and hidden costs,
- And using dedicated tools such as the HR Cost Calculator and other HR tools on HRYP.com,
HR leaders can move from rough estimates to data-driven decisions.
The result? Better hiring decisions, more realistic budgets, and a stronger strategic partnership between HR and finance.
FAQ: Real Cost of an Employee
What is the real cost of an employee?
The real cost of an employee is the total amount your company spends to employ them, including salary, employer taxes, benefits, tools, overhead, training, and a share of turnover costs. In many cases, it’s between 1.25 and 1.4 times the base salary, and sometimes higher for roles with rich benefits or high turnover.
How do I quickly estimate employee cost without a full model?
A quick way is to multiply base salary by a cost multiplier:
- Conservative: 1.25×
- More realistic: 1.3–1.4×
For example, a $70,000 salary at 1.35× costs around $94,500 per year. For a more accurate result, use a tool like HRYP’s HR Cost Calculator to plug in benefits, taxes, and overhead.
Why is turnover so expensive?
Turnover includes recruitment costs, vacancy time, onboarding a replacement, and lost productivity. Depending on the role, replacing an employee can cost from one-third up to two times their annual salary. This is why investments in engagement, recognition, and better hiring processes can pay for themselves.
How does cost-per-hire relate to the real cost of an employee?
Cost-per-hire is one component of the real cost of an employee. It covers what you spend to recruit and hire a new employee (ads, agency fees, recruiter time, etc.). Recent benchmarking data suggests average cost-per-hire in the U.S. is around $4,700–$4,800, and rising.
When you calculate the real cost of an employee, you may include cost-per-hire as part of turnover and onboarding costs.
How can HR tools help reduce the real cost of employees?
HR tools help by:
- Reducing time-to-hire and cost-per-hire
- Automating payroll and compliance to avoid costly errors
- Improving engagement and performance, which lowers turnover
- Providing better data so you can right-size teams and reward top performers
On HRYP, you can explore solutions in the HR Tools section, compare payroll providers, and use tools like Candidate Skill Testing and the HR Cost Calculator to make more informed decisions.
Want a permanent backlink in this article?
Choose your anchor text. Stays live forever — from $49/yr.
)